
Imagine yourself as a sales manager at a growing company, and you have a team meeting in an hour. You need to present the latest sales figures, pinpoint bottlenecks in the sales process, and showcase top-performing team members. Instead of sifting through spreadsheets and reports, you open your Dashboards in Zoho CRM.
On your screen, you see a real-time visual of your sales pipeline. You can see the charts showing conversion rates, a list of top deals closing this week, and key performance indicators (KPIs) tracking monthly targets. In no time, you’re equipped with insights that can guide your team’s strategy for the week. This is the power of Zoho CRM dashboards.
In today’s fast-paced business world, data is king. But data alone isn’t enough. It’s how you interpret and use it that matters. Zoho CRM Dashboards offer a powerful way to visualize data and gain insights that drive smart decisions. Whether you’re a sales manager, marketer, or business owner, mastering Dashboards can transform your operations. In this blog article we will explore this in detail.
Dashboards in Zoho CRM is a customizable platform where you can visually represent your business data in an intuitive and accessible way. You can create Reports from the data across different modules and present them in a pictorial view that’s easy to understand at a glance. By using dashboards, you can swiftly spot trends, track performance against key performance indicators (KPIs), understand your business health, and make informed decisions based on the latest data. These feature enables you to keep a finger on the pulse of your business and respond quickly to changing circumstances.
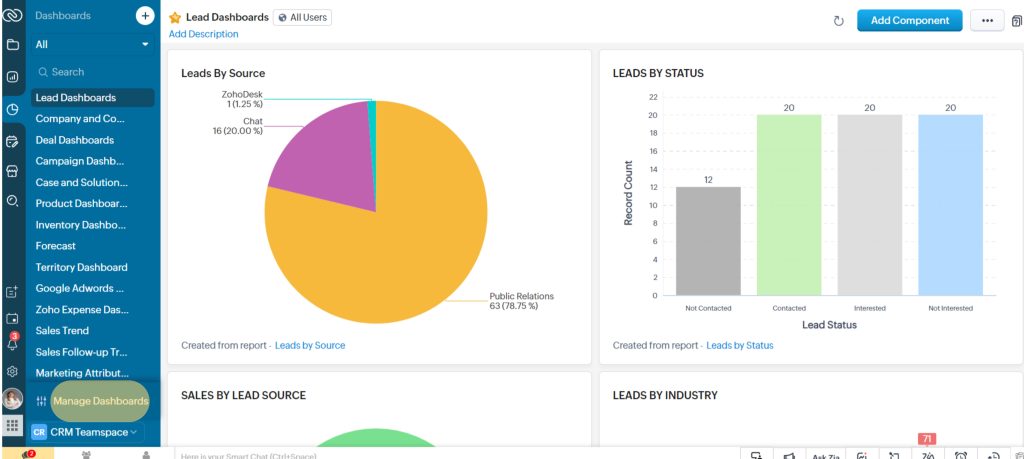
You can locate the Dashboards Module in the primary sidebar of the New Zoho CRM interface.
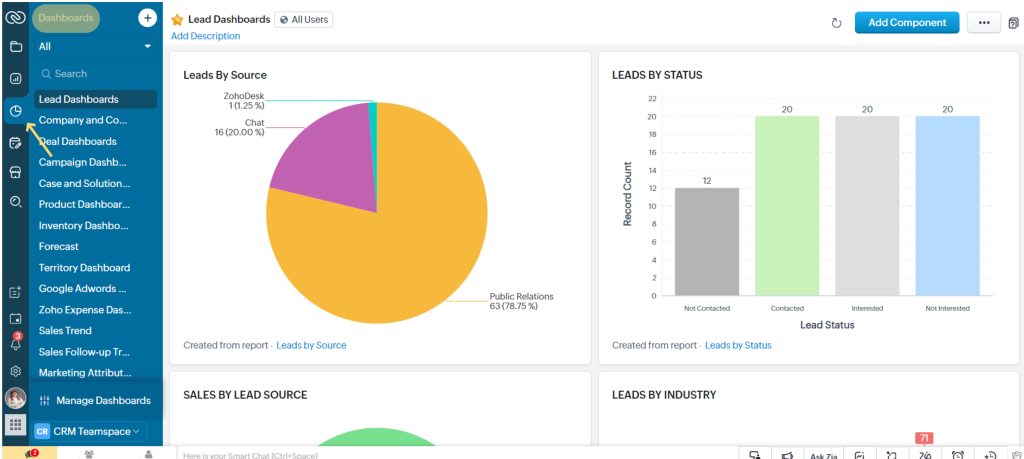
In the secondary bar, you can find all the different types of Dashboards related to Leads, Contacts, Deals, and much more.
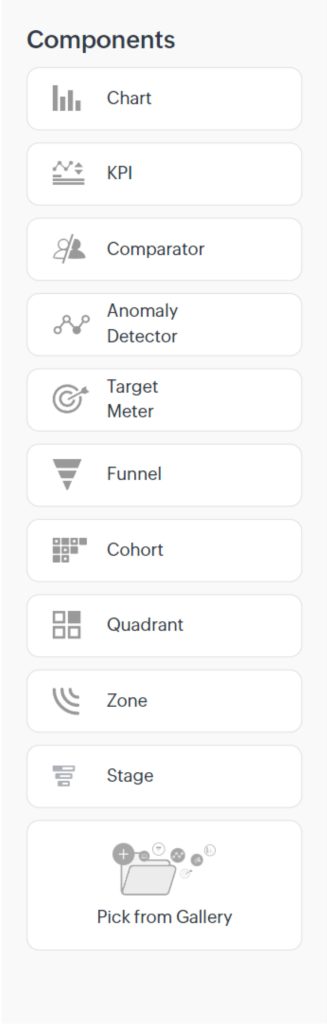
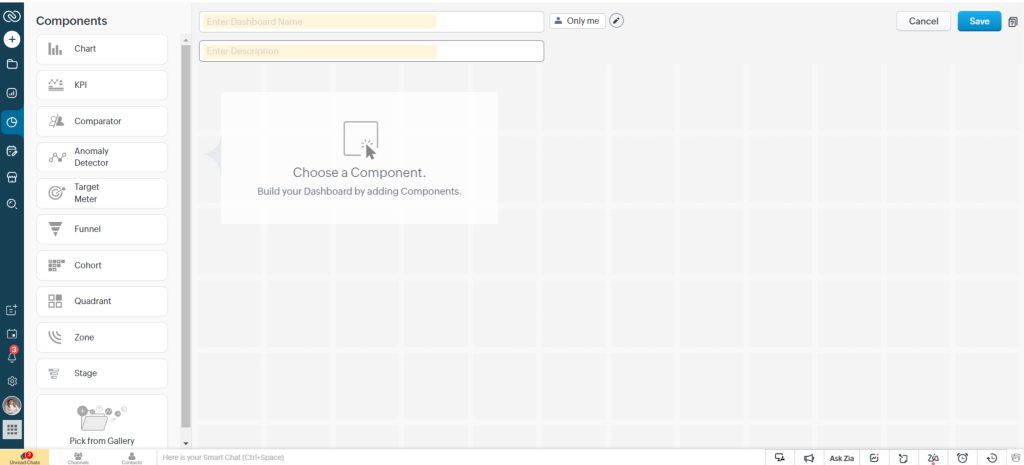
Zoho CRM offers a variety of analytics components that users can add to their dashboards for powerful insights. Here’s a list of the components available:
Zoho CRM Dashboards are packed with features that empower you to transform raw data into real-time insights. With a range of customizable scopes, these dashboards provide a versatile platform for visualizing your CRM data. Here are some of the standout features that make Zoho CRM dashboards an essential feature tool for any business.
We have Reports on Zoho CRM to for representation of data then why do we need Dashboards? While reports in Zoho CRM provide detailed data analysis, dashboards offer dynamic visual representations that support business decision-making. Dashboards use intuitive visual elements like charts and graphs to simplify complex data, enabling users to quickly grasp key insights. Unlike reports, which can be overwhelming with detailed tables, dashboards provide a pictorial view of essential metrics at a glance. They update in real time, allowing for prompt actions.
Now let us have a look at how we can create Dashboards in Zoho CRM.
Creating Dashboards in Zoho CRM is a straightforward process that enables the user to visualize the data effectively and make the right business decisions. Here is a simple guide for how you can build a customized dashboard that meets your specific requirements.
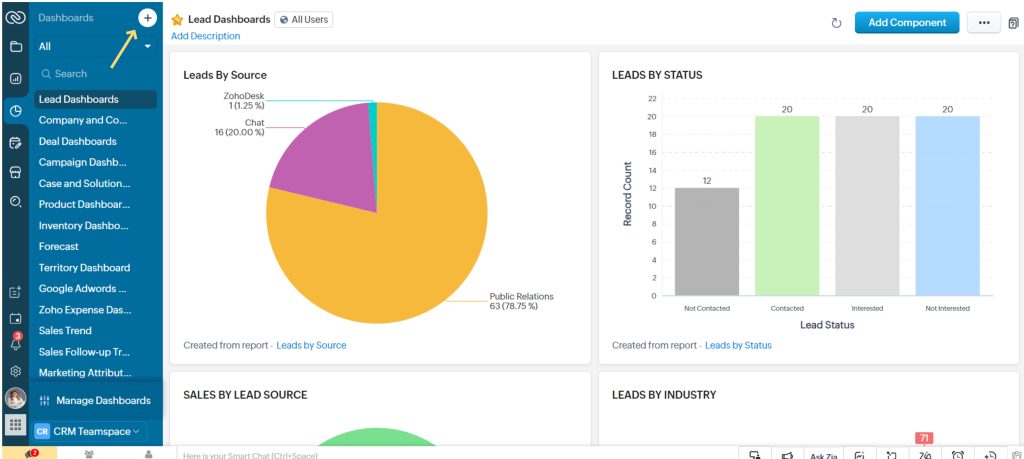
Click on the Dashboards Module from the primary bar of your New Zoho CRM Interface.
Click on the + icon to Create a new dashboard
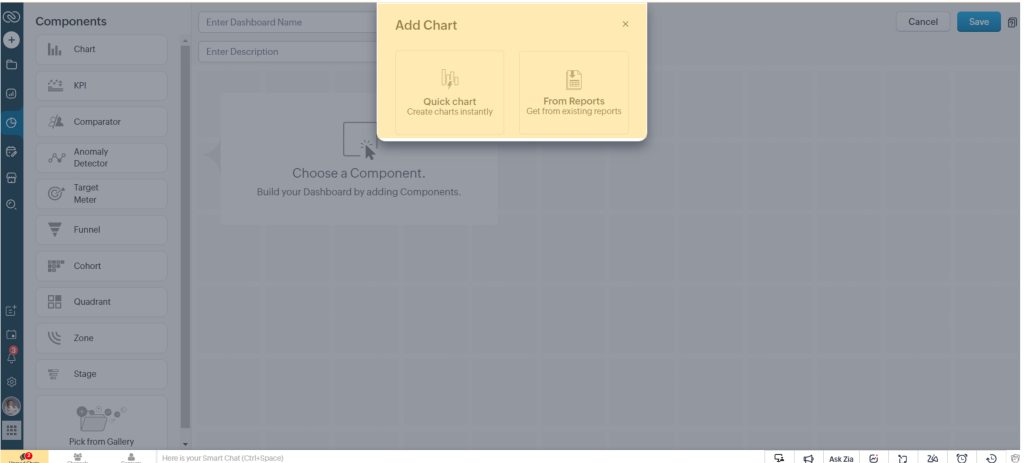
Select the preferred component for your Dashboard.
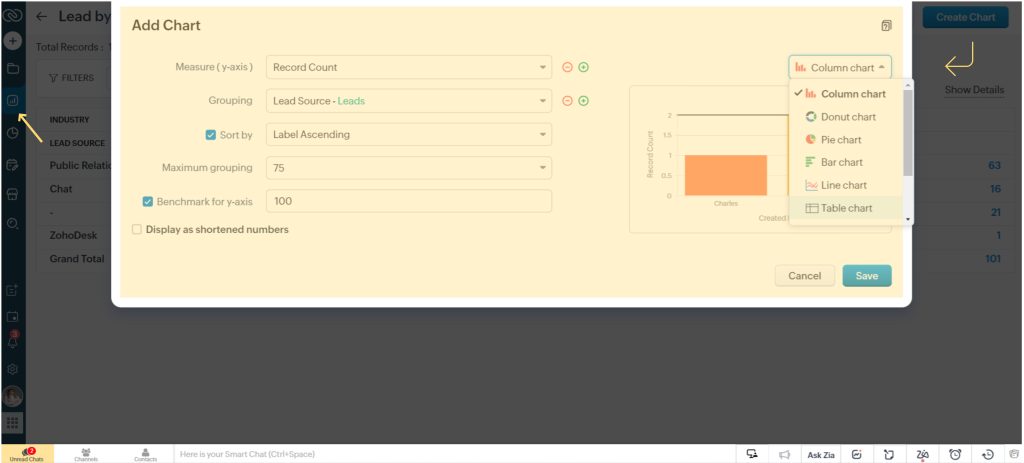
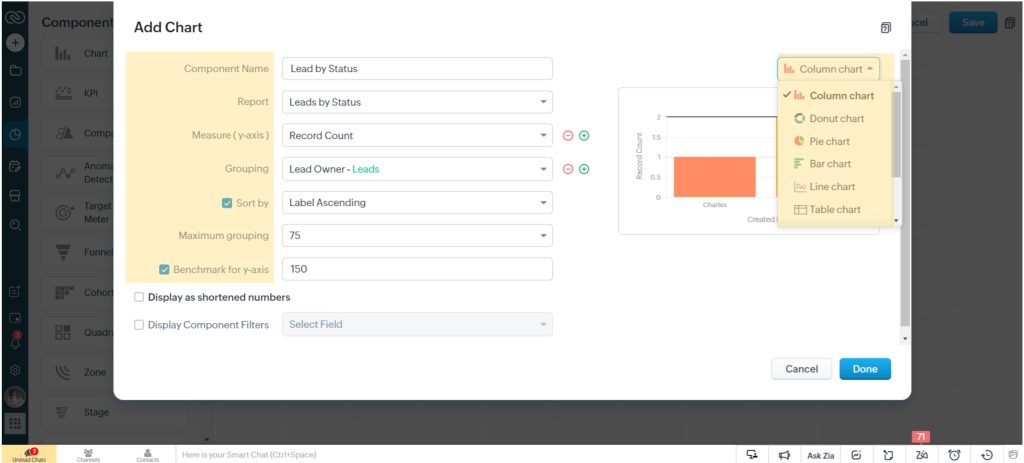
For example, if you select Charts as your preferred component, you will spot 2 options. You can either create a Quick Chart or choose from the already created Reports in your CRM.
Another way to create Dashboards is from your Reports. You can open a report and click on Create Chart. Here you can customize the chart as shown below and you are good to go.
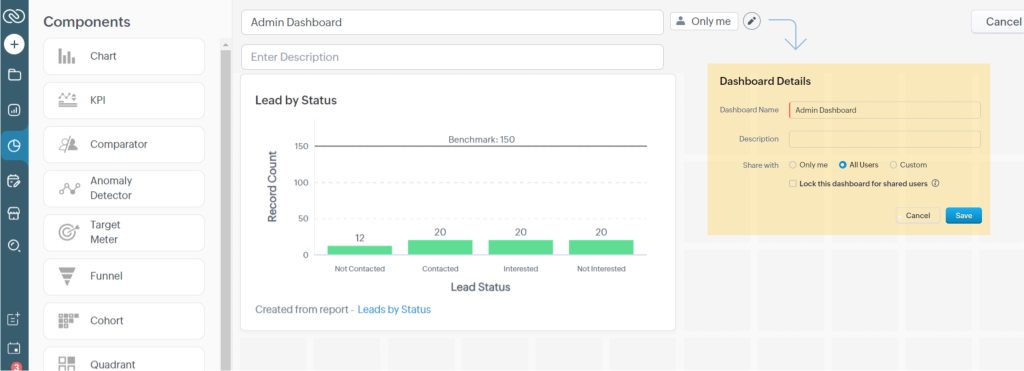
In the Dashboard page, set a Dashboard Name and Description.
This way you can add up to 20 components in one Dashboard.
Now when creating dashboards, you can also share their access to other user in your organization.
Click beside “Only Me” and select your preference for sharing.
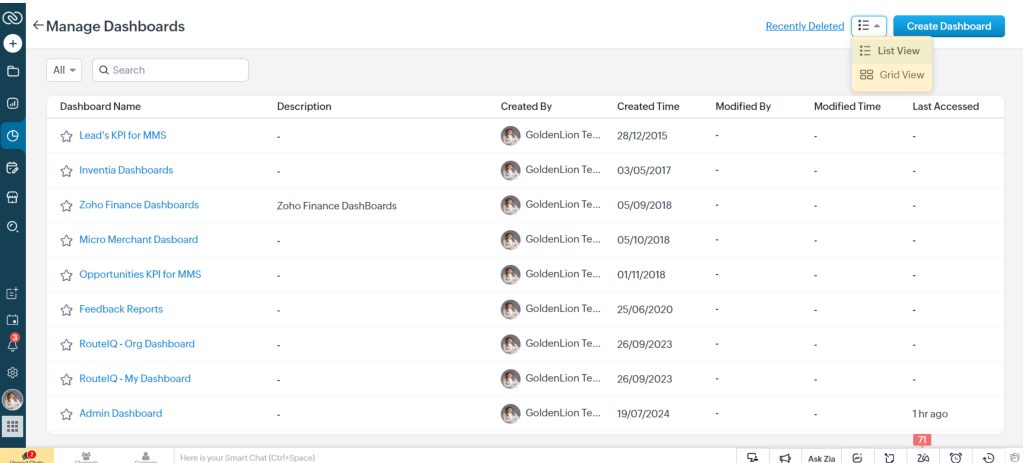
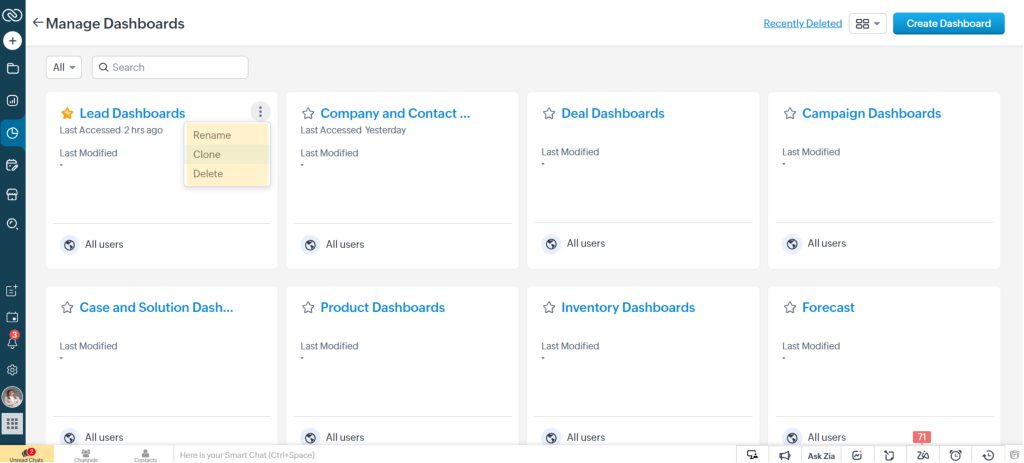
To manage your Dashboards in Zoho CRM, you click on the Manage Dashboards in the secondary bar.
With this feature, users can view their dashboards in List View and Grid View. The list view offers a simple format for quick navigation, while the grid view gives you a more detailed look. This flexibility ensures you can choose the viewing style that best suits your needs for accessing and reviewing your dashboards.
The Manage Dashboards in Zoho CRM option helps you keep track of all your dashboards by bringing them together in one place. It allows users to easily perform key actions like renaming the dashboards, cloning them, and deleting them as well.
Dashboards in Zoho CRM are a game-changer for businesses looking to harness the power of their data. By providing real-time visuals and a variety of analytical components, the dashboards enable you to quickly identify trends, measure performance, and make informed decisions. Whether you’re tracking sales performance, monitoring team KPIs, or analyzing customer behavior, Zoho CRM dashboards offer the tools you need to stay ahead in a fast-paced business environment. Let’s make sure that your valuable data is not underutilized.
Start leveraging Zoho CRM Dashboards today to transform how you visualize and manage your business data. Set up your customized dashboard, explore its powerful features, and make data-driven decisions that drive success.
Are you ready to unlock the power of your Zoho CRM? Here are our experts to help you!